Friday, October 9, 2026 · Trucking & Freight
Truck Capacity Cuts Drive 2026 Rate Gains as Freight Volumes Edge Up
Noted by Julie Van de Kamp · 929 reads
SONAR data points to a capacity led rate recovery: rejection rates have surged while tender volumes rose modestly and carrier costs remain high.
Truckload rates are gaining ground in 2026 because fewer trucks are available to haul freight. SONAR data shows tender rejections have climbed far faster than tender volumes, while carrier operating costs remain elevated. That points to a capacity led recovery, with rates still below the levels needed to rebuild carriers’ overhead cushion.
The gap between rates and costs helps explain why carriers have been leaving the market. The American Transportation Research Institute (ATRI) reported an average truck operating cost of $2.336 per mile in 2025, a record and a 3.4% increase from 2024. Without fuel, costs increased 4.2%, exceeding inflation by 1.5 percentage points. SONAR’s Sitrep, The Repricing Isn’t Finished, estimates the rate correction is only about halfway complete.
Costs keep pressing on carrier margins
ATRI’s 2026 Operational Costs of Trucking study found record highs across nearly every cost category. Tolls rose 13.2% in 2025, repair and maintenance increased 8.6%, driver benefits climbed 6.6%, and tire costs went up 6.4%. Early 2026 data points to further pressure from insurance, up 6.4%, and fuel, up 5.9%. SONAR’s diesel index (DTS) stood at $6.38 per gallon in the source data.
These increases matter because freight rates must cover more than fuel and the expense of running a particular load. Carriers also need enough revenue to support overhead. When revenue covers only the direct expense of operating a truck, there is little left to support the business or add equipment.
Contract rates remain below the earlier benchmark
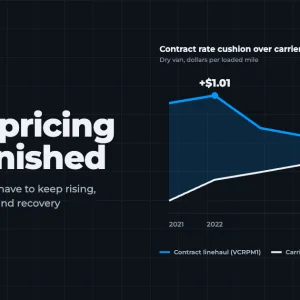
SONAR’s dry van contract linehaul series, VCRPM1, averaged $2.81 per mile in 2022. It fell to $2.32 in both 2024 and 2025, while truckload carriers’ non-fuel costs rose 30% from 2021 through 2025.
- In 2022, contract linehaul exceeded non-fuel cost by about $1.01 per loaded mile.
- By 2025, the difference had narrowed to $0.26.
- SONAR’s spot linehaul measure, NTIL, remained below non-fuel cost in each year from 2023 through 2025.
Contract linehaul averaged $2.69 per mile in Q3 2026, according to the source. That was still below the Q4 2021 level, and it restored only about half of the margin cushion carriers had in 2022. The comparison suggests that rising rates have yet to make up for the combination of earlier rate declines and higher operating expenses.
Capacity is tightening faster than freight volumes
SONAR’s tender rejection index (STRI) rose 268% from October 2023, while its tender volume index (STVI) increased about 9%. Those measures describe different parts of the market: tender volume tracks freight offered under contract, and rejections reflect the share of those loads carriers decline. A widening gap between them is consistent with fewer available trucks competing for a broadly similar amount of contracted freight.
Other figures in the report point in the same direction. For-hire tractor counts fell by about 51,000 in one month, and ATRI found that carriers reduced effective capacity by 5.5% in 2025. ATRI describes the pattern as a supply side recovery. In practical terms, that means rate pressure can build as trucking capacity contracts, even without a comparable rise in freight volumes.
Higher rates are needed before fleets can expand
SONAR’s Sitrep models a typical dry van truck at Q3 2026 benchmark rates. The truck covers its marginal costs, but contributes only about 15% of revenue toward overhead. ATRI’s truckload carriers needed roughly 26% in 2025 to meet that overhead requirement. Based on the model, rates would need to rise about 14% to close the difference.
Running the truck close to the hours of service limit does not fully solve the problem: the model still leaves it about 5% short. That calculation shows why simply putting more miles on existing equipment may not restore carrier margins. Extra miles can add revenue, but they also require the truck, driver and other operating resources to remain in use.
For fleet operators, the figures suggest that adding trucks at current benchmark rates could leave new equipment without enough revenue to support overhead. For shippers and brokers, the capacity decline helps explain why contract rates can rise while reported freight volumes increase only modestly. Rate discussions will turn on both current coverage and whether carriers can earn enough to keep equipment in service.
More detail in the SONAR report
The full Sitrep includes comparisons across freight modes, with reefer contract rates identified as furthest behind the market. It also maps tender rejections by market to show where carriers are already repricing, and examines the Chicago to Atlanta lane with a projection into 2027.
The report also offers an interactive calculator that tests contract and spot mix, miles, diesel and deadhead against carrier costs. Its takeaways address shippers, carriers and brokers preparing for 2027 bids. Those details can help readers assess how a broad capacity shift may differ by equipment type, market and lane.
SONAR Sitreps and the data cited in them are available through the SONAR platform. Request a demo. Sitreps are also included with a subscription to FreightWaves Market Monitor; details are at getfreightdata.com.
What the figures say about the market
SONAR’s lane projection for Chicago to Atlanta shows rates holding near current levels into 2027. That projection sits alongside the cost and capacity measures in the Sitrep; it is not a substitute for monitoring the specific markets and freight mixes that shape individual bids.
For current planning, the main signal is the gap between the amount carriers earn and the cost of keeping trucks available. Contract linehaul has recovered from its 2024 and 2025 average, yet the cited Q3 2026 rate remains below Q4 2021 and the modeled truck still falls short of its overhead target. The pace and location of further repricing will depend on how capacity and tender activity develop.
Sources: SONAR (VCRPM1, NTIL, NTI, STRI, STVI, DTS, TCFH); ATRI, Analysis of the Operational Costs of Trucking: 2026 Update (July 2026).