Wednesday, October 7, 2026 · Trucking & Freight
Trucking Capacity Shrinks as Tender Rejections Climb in 2026
Noted by Julie Van de Kamp · 734 reads
New-fleet tractors fell as tender rejections surged, leaving shippers facing a tight truckload market through early 2027.
Truckload capacity is contracting even as carriers reject far more contracted loads. SONAR data through October 2026 shows tender rejections up 268% over three years, while truckload volume rose 9%. The gap points to fewer available trucks, rather than a sharp jump in freight demand, as the main source of tightening.
New for-hire fleets had 19,520 tractors in August, about 14% below their first-half average, SONAR reports. The total for-hire tractor count fell by about 51,000 that month. With new fleets failing to replace trucks leaving the market, the data suggests shippers should expect constrained truckload capacity into early 2027.
Why this cycle has not drawn in new trucks
In the 2020–2022 cycle, high tender rejections were followed by fleet expansion. When SONAR’s Truckload Rejection Index (STRI) surged in mid-2020, tractor counts in new for-hire fleets began climbing within a couple of quarters. They peaked at about 47,000 in mid-2022.
The current pattern has reversed. New-fleet tractor counts fell from that peak, bottomed in early 2025, rose briefly in spring and then flattened. STRI began climbing sharply in fall 2025, but new-fleet tractor counts have since turned down again. The usual response—new trucks entering as rejection rates rise—has not appeared.
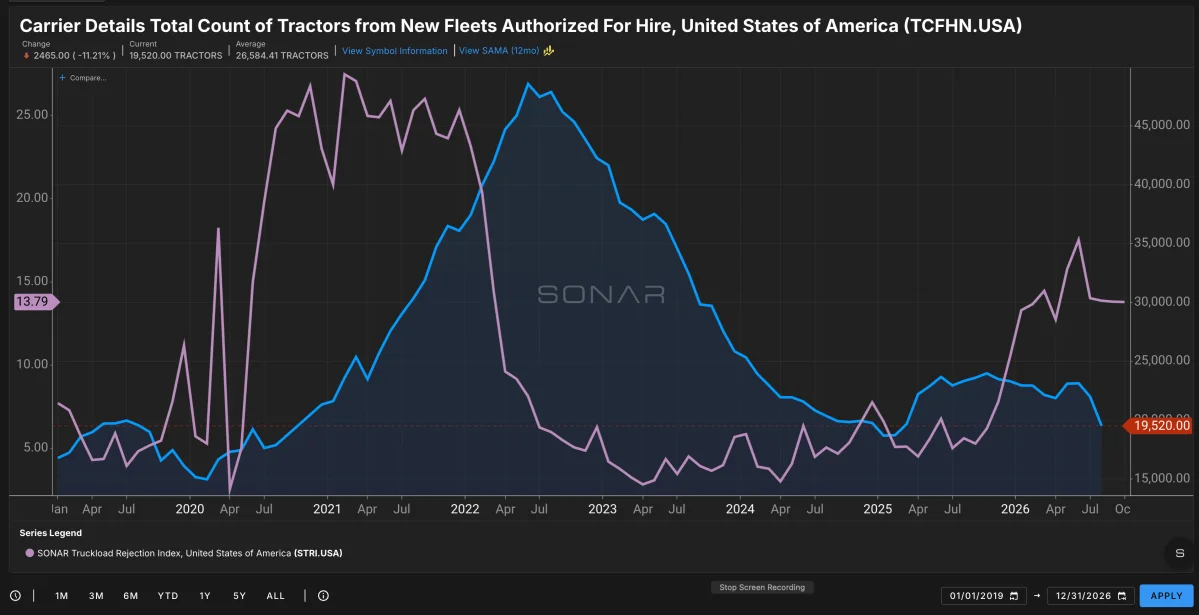
Tender rejections rose in 2025–2026 as tractors in new for-hire fleets declined.
Freight volume offers little evidence of a demand surge that could explain the change. Over the three years ending October 2026, SONAR’s Truckload Volume Index (STVI) increased 9%, compared with a 268% increase in STRI. At the early-summer 2026 peak, rejections were up more than 350%.
In a market driven mainly by rising demand, volume and rejections would be expected to move more closely together. Instead, carriers are turning down substantially more loads on roughly similar volume. The American Transportation Research Institute (ATRI) likewise characterizes the 2026 rate gains as a supply-side recovery. That points to capacity leaving the market as the central factor shippers need to track.
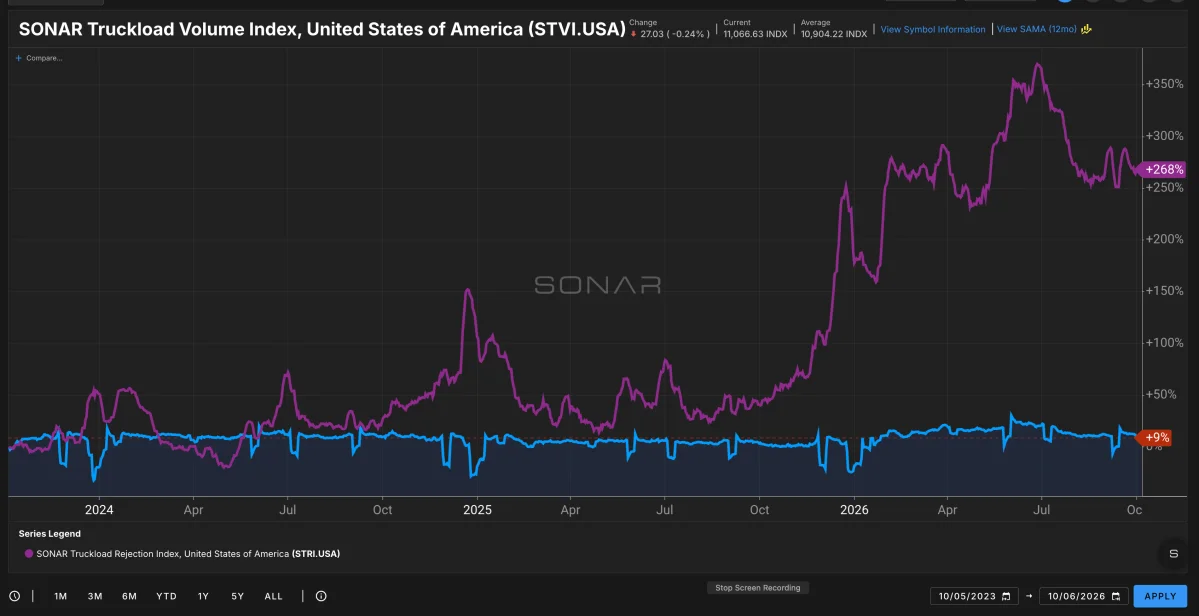
SONAR’s three-year comparison shows truckload volume up 9% and tender rejections up 268%.
Why rising carrier counts can give the wrong signal
Operating authority counts don’t show how many trucks are working. An authority, or MC number, permits a company to haul regulated freight for hire across state lines. A one-truck owner-operator and a fleet with 5,000 trucks each count as one authority. From 2019 to 2022, total authorities increased 51%, while for-hire tractors grew just 12.
The latest jump in authority counts also reflects recordkeeping changes. Net additions exceeded 2,000 a week in late August and late September 2026, a five-year high. Over the same period, the Federal Motor Carrier Safety Administration’s Motus registration system paused deactivations and worked through a backlog of applications and reinstatements. Net revocations turned negative for the first time since at least 2019, while estimated new grants were about 17% below the first quarter. The increase in net counts therefore doesn’t establish that more operating trucks entered the market.
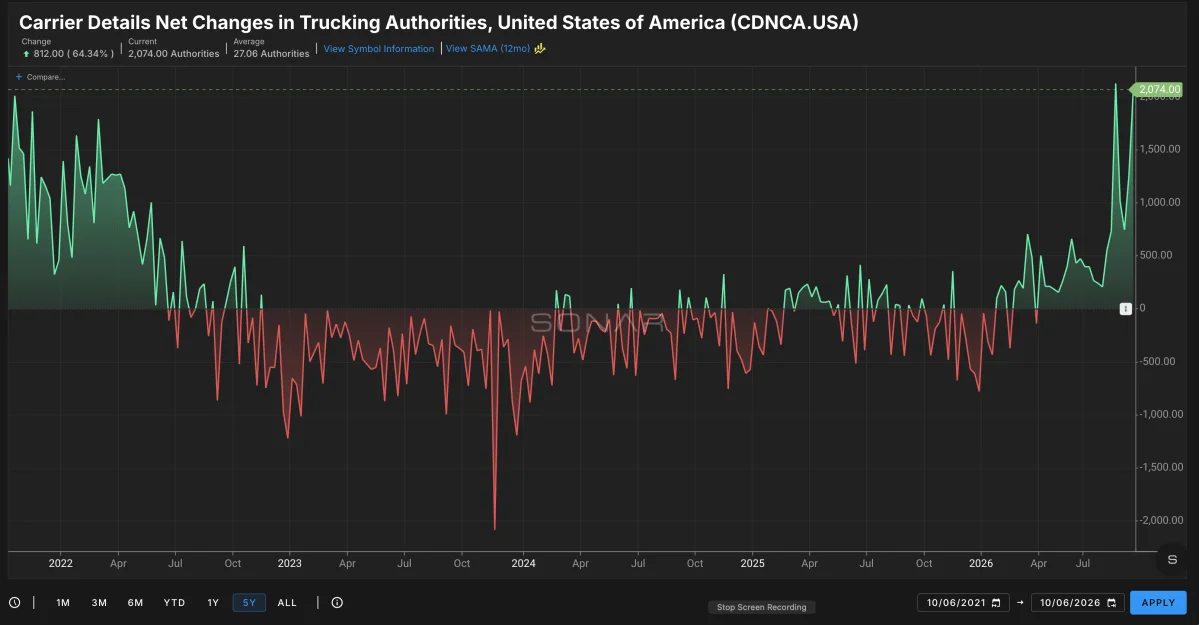
Weekly net authority additions rose above 2,000 in late 2026.
Insurance filings offer another way to distinguish new entrants from registration activity. Only about two in three new interstate registrants now purchase liability insurance, compared with more than nine in ten in 2019, according to the SONAR analysis. A registration on its own doesn’t show that a carrier has obtained coverage, put a truck on the road or begun hauling.
Entry costs and driver availability weigh on capacity
Three pressures are making it harder to add trucks: a smaller pool of eligible drivers, rising insurance costs and thin operating margins. As of Jan. 2, 2026, 202,345 CDL and permit holders were listed in prohibited status in the Drug and Alcohol Clearinghouse. A non-domiciled CDL rule that took effect March 16, 2026, could affect up to 194,000 drivers over time. SONAR data also indicates that English-language-proficiency enforcement takes about 2,700 drivers out of service each month.
Insurance adds to the cost of staying in business. ATRI says liability and cargo premiums rose 3.9% in 2025, reaching about 10.6 cents per mile, even as crash rates fell. Premiums continued climbing in early 2026. For a small carrier, a lapsed policy can lead to loss of its operating authority.
Margins leave little room to absorb those costs or justify fleet expansion: truckload operating margins were barely positive in 2025. Large fleets have also described driver availability as a constraint. In second-quarter 2026 results, Schneider called the market driver-constrained; Knight-Swift and Werner said driver availability was limiting their fleets.
Signals for shippers to watch
SONAR’s outlook is for a tight truckload market through early 2027, with STRI remaining well above the 4% to 6% range seen from 2023 through 2025. Parked trucks could offer some relief: ATRI found that about 10% of carrier trucks sat without a driver in 2025. Those trucks can return only when carriers find eligible drivers to put behind the wheel.
Shippers can watch for tractor counts and new-fleet tractor numbers to rise for at least two consecutive months; STRI to fall while STVI holds steady; and first-time insurance filings to increase. Those measures speak more directly to trucks entering service than authority totals do. A sustained improvement across them would provide a clearer sign of added capacity.
SONAR’s The Authority Illusion examines seven years of authority, tractor, insurance and registration data, alongside a 2026 capacity scorecard and indicators for shippers. It’s available through FreightWaves Market Monitor and the SONAR platform. SONAR also offers access to real-time tender rejections, volume and carrier fleet data.
Sources: SONAR (STRI, STVI, TCFHN, TCFH, CDNCA, CDNR and ELPVOOS); ATRI, An Analysis of the Operational Costs of Trucking: 2026 Update; Drug and Alcohol Clearinghouse Monthly Report, December 2025; Transport Topics coverage of Schneider’s second-quarter 2026 results; FMCSA Licensing & Insurance and Company Census data.
===