Wednesday, November 18, 2026 · Trucking & Freight
Truckload Capacity Shrinks as Rates Recover, Setting Up Higher 2027 Contract Bids
Noted by Julie Van de Kamp · 526 reads
SONAR data show rising rates, fewer for-hire tractors and uneven capacity, with dry van contract rates still below carrier overhead.
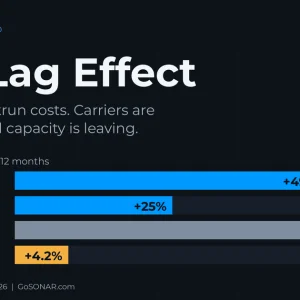
Truckload pricing has moved above carriers’ non-fuel operating costs, but the recovery is arriving after years of losses and a sharp reduction in available tractors. For shippers, the combination points to tighter routing guides and more upward pressure in 2027 contract bids, especially in lanes where tender rejections are already high.
Rates have cleared non-fuel costs
SONAR’s national spot linehaul index, NTIL.USA, stood at $2.60 per mile as of Nov. 13, 2026, up about 49% year over year. That is roughly $0.75 above the American Transportation Research Institute’s 2025 non-fuel operating cost estimate of $1.854 per mile. Spot linehaul had remained below non-fuel costs for three consecutive years, from 2023 through 2025.
Dry van contract base rates, tracked by SONAR’s VCRPM1 index, reached $2.88 per mile, an increase of about 25% year over year. Diesel was $6.15 per gallon, up about 62%, adding roughly $0.36 per mile to fuel costs. ATRI reported that non-fuel operating costs rose 4.2% in 2025, reaching a record $1.854 per mile.
The rate recovery has not erased the financial damage from the downturn. Dry van contract linehaul gave carriers about $1.01 per loaded mile above non-fuel costs in 2022. By 2025, that margin had fallen to roughly $0.26. Smaller carriers that relied heavily on spot freight often exhausted cash reserves before rates improved. More than 1,000 logistics job cuts and 15 bankruptcy filings were reported within a few weeks in the fall covered by the data.
Fuel exposure adds to the pressure on small operators. Spot prices are quoted as all-in rates, so carriers generally absorb diesel increases until market prices adjust. Fleets hauling contracted freight can recover most fuel costs through separate surcharges, leaving spot-dependent carriers more exposed to sudden changes at the pump. The bankruptcies reflect losses accumulated during 2023 through 2025, even as current rates have risen.
For-hire tractor counts are falling
SONAR counted 1,551,161 tractors in for-hire fleets under its TCFH.USA measure. That was about 107,000 fewer than a year earlier, including a decline of roughly 51,000 in a single month this summer. The series, which goes back to 2008, has not recorded a larger drop.
Other measures point to a tighter market. SONAR’s Truckload Rejection Index, STRI.USA, was 12.87%, about twice its level a year earlier and more than three times the October 2023 reading. Truckload volume, measured by STVI.USA, was roughly at its October 2023 level. The data therefore show fewer trucks competing for a similar volume of freight.
Some of the reported fleet decline may reflect the launch of the Federal Motor Carrier Safety Administration’s Motus registration system in May. Public fleet figures also show reductions: Knight-Swift’s average tractor count fell 4% year over year, while Schneider’s fell 8%. Schneider and Werner together have reduced their one-way fleets by 38% since 2021.
Capacity varies sharply by location and equipment
National figures mask substantial regional differences. Tender rejections reached 23.19% in the Northwest and 17.55% in the Midwest, compared with the national rate of 12.87%. The tightest individual markets listed were Quincy, Illinois, at 49.42%; Pendleton, Oregon, at 42.18%; Spokane at 39.34%; and Sioux Falls at 38.21%.
Several large Sun Belt markets remained looser. Atlanta recorded a 7.82% rejection rate, Dallas 7.91%, and Houston 6.49%. The difference matters for procurement: national benchmarks can obscure the availability and pricing conditions facing a specific lane, origin or destination.
The pressure also extends beyond dry vans. SONAR’s reefer and flatbed tender rejection measures, STRIR and STRIF, were both above 21%. Spot rates for van, reefer and flatbed were each up roughly 50%, according to the report. Shippers with temperature-controlled or specialized freight may face tighter capacity even when a national average appears less strained.
2027 bids may bring further increases
Dry van contract base rates remain about 6.5% below the level needed to cover carrier overhead, according to the analysis. The gap between spot and contract rates narrowed from about $0.57 to $0.28 per mile over the past year. That convergence suggests contract pricing still has room to adjust as capacity contracts and carriers seek to rebuild margins.
Refrigerated freight has more ground to make up. SONAR’s RCRPMF reefer contract base rate index is up about 8% and sits roughly $0.30 per mile below dry van contract pricing. The report’s base case projects dry van contract increases of about 5% to 8% in 2027, with double-digit increases possible if capacity continues to leave the market.
For shippers preparing bids, the operational takeaway is to assess routing guides lane by lane. Regional rejection rates and equipment type can produce conditions that differ sharply from national averages. Contract pricing, carrier coverage and backup options will need to reflect those local differences as the market resets.
A tender rejection rate measures the share of contracted loads carriers decline. SONAR tracks the measure daily; a rising rate indicates carriers have better freight options than the contracted loads being offered. The data cited here include SONAR indices pulled Nov. 13, 2026; ATRI’s July 2026 update on trucking costs; and fleet figures from Knight-Swift, Schneider and Werner.


