Monday, November 16, 2026 · Trucking & Freight
Q3 2026 Freight Earnings Show Tight Capacity and Higher 2027 Bid Rates
Noted by Julie Van de Kamp · 430 reads
SONAR data points to a supply-driven recovery, with higher rates lifting some carriers while fuel and contract structures squeezed others.
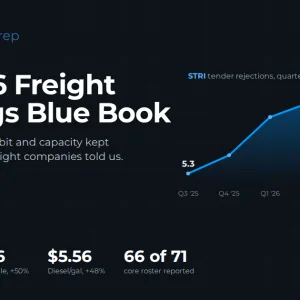
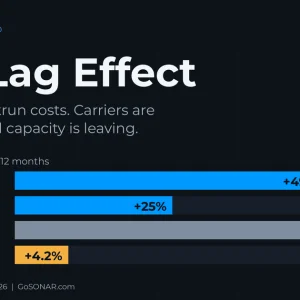
Freight capacity tightened through the third quarter of 2026, and that shift shaped earnings across trucking, rail, ocean shipping and forwarding. SONAR’s tender rejections averaged 14.5%, nearly three times the 5.3% recorded a year earlier, while tender volume rose 8.5%. The pattern points to capacity leaving the market more than a surge in freight demand.
That distinction matters as shippers prepare for 2027 bids. Carriers able to reprice quickly, especially in one-way truckload, captured stronger margins. Dedicated fleets and smaller contract carriers had less room to adjust rates while fuel, wages and insurance costs climbed. Diesel averaged $5.56 per gallon in Q3, up 48% year over year, adding pressure across modes and lifting reported revenue where fuel surcharges applied.
Capacity tightened as freight volumes grew modestly
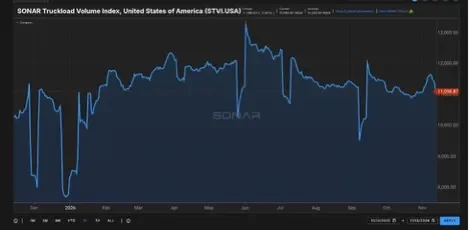
SONAR’s National Truckload Index averaged $3.46 per mile in Q3, 50% above the same period last year. Its tender data showed rejections rising from about 6% in November 2025 to a late-June peak near 17.6%. On Nov. 13, the STRI stood at 12.87%, roughly double its year-earlier level. Tender volume, outside holiday dips, remained between about 11,000 and 12,500 through the year.
Carrier actions aligned with those signals. Knight-Swift, Schneider, Covenant and TFI International reduced fleet sizes by 4% to 12% and pursued higher rates. Roper, which owns DAT, also characterized the load board recovery as supply-driven. Of the 71 companies on SONAR’s core roster, 66 had reported Q3 results, along with eight supplemental companies.
Truckload results hinged on the ability to reprice
One-way truckload operations generally gained more pricing power than dedicated fleets. Werner’s revenue per truck per week rose 34.3% in one-way service, compared with 5.6% in dedicated. Schneider recorded increases of 21.4% and 3.1%, respectively. Covenant’s expedited one-way business gained 12%, while dedicated revenue per truck per week advanced 6.2%.
Knight-Swift’s mix helped it translate rate gains into better margins. With roughly three-quarters of truckload revenue coming from one-way freight, it raised revenue per mile 12.2% as cost per mile increased 3.8%. Its adjusted truckload operating ratio improved 700 basis points to 89.2%. J.B. Hunt’s dedicated segment moved in the other direction: operating income fell 22%. Pamt, a smaller contract carrier, reported a 109.1% truckload operating ratio, marking its 12th consecutive quarterly truckload loss.
The spread between these results puts pricing flexibility at the center of the coming bid season. Contract structures with annual index adjustments may take longer to reflect a rapid change in spot rates and operating costs.
LTL volumes improved, while rail results split on fuel costs
Less-than-truckload tonnage turned positive at Old Dominion in September after two years of declines, then gained pace across the sector in October. ArcBest’s tonnage rose about 15%, Saia’s about 10% and XPO’s about 6.5%. Shipments were getting heavier, a sign that LTL carriers were taking freight that tighter truckload capacity could no longer move as cheaply. XPO’s adjusted LTL operating ratio improved 260 basis points to 80.1%.
All six Class I railroads increased revenue by 12% to 15%, while volume grew 3% to 6%. Fuel expense rose between 56% and 69%, making fuel management a major factor in margins. CSX improved its operating ratio by about 420 basis points; Norfolk Southern’s ratio worsened 280 basis points. Intermodal stood out, with record volume at CSX and a 27% increase in intermodal revenue at Union Pacific.
Ocean and forwarding profits face a softer outlook
Ocean carriers and freight forwarders recorded some of the largest profit swings in the quarter, driven largely by pricing. Maersk’s loaded rates increased 46% despite slightly lower volume. Expeditors’ earnings per share rose 62%, as air freight tied to hyperscalers and their suppliers increased with demand for AI-related shipments.
Industry expectations for 2027 are less favorable. Drewry projects container capacity growth of 8.8%, compared with demand growth of 6.2%. That gap points to more available vessel capacity relative to projected cargo demand than carriers experienced during the strong pricing period.
What shippers should track before 2027 bids
Van contract rates are climbing alongside spot pricing. SONAR’s VCRPM1 measure rose from about $2.31 per mile a year earlier to $2.88 in mid-November, a 12-month high; the Q3 average was $2.70, up 17.5% year over year. The increase accelerated in October.
Knight-Swift expects to open bids with low-to-mid double-digit increases. Werner anticipates double-digit gains on one-way business it reprices in the first half of 2027. Truck orders are trailing deliveries ahead of final EPA 2027 rules, which the source data says could slow capacity rebuilding. For shippers, the near-term signals to monitor are tender rejections and contract-rate movement: the article identifies STRI above 12% as a threshold that would support double-digit contract increases as the base case.
The quarter’s clearest operating lesson is that market exposure mattered as much as headline freight growth. Shippers entering bids should account for the difference between one-way and dedicated capacity, continued fuel costs, and the possibility that ocean capacity growth will outpace demand.