Tuesday, September 29, 2026 · Ocean Shipping & Ports
Why Average Order Volume Can Mislead 3PL Capacity Planning
Noted by James Davis · 322 reads
Two brands with the same annual orders can create very different warehouse demands. Seasonal peaks, inbound timing and channel mix shape the operation.
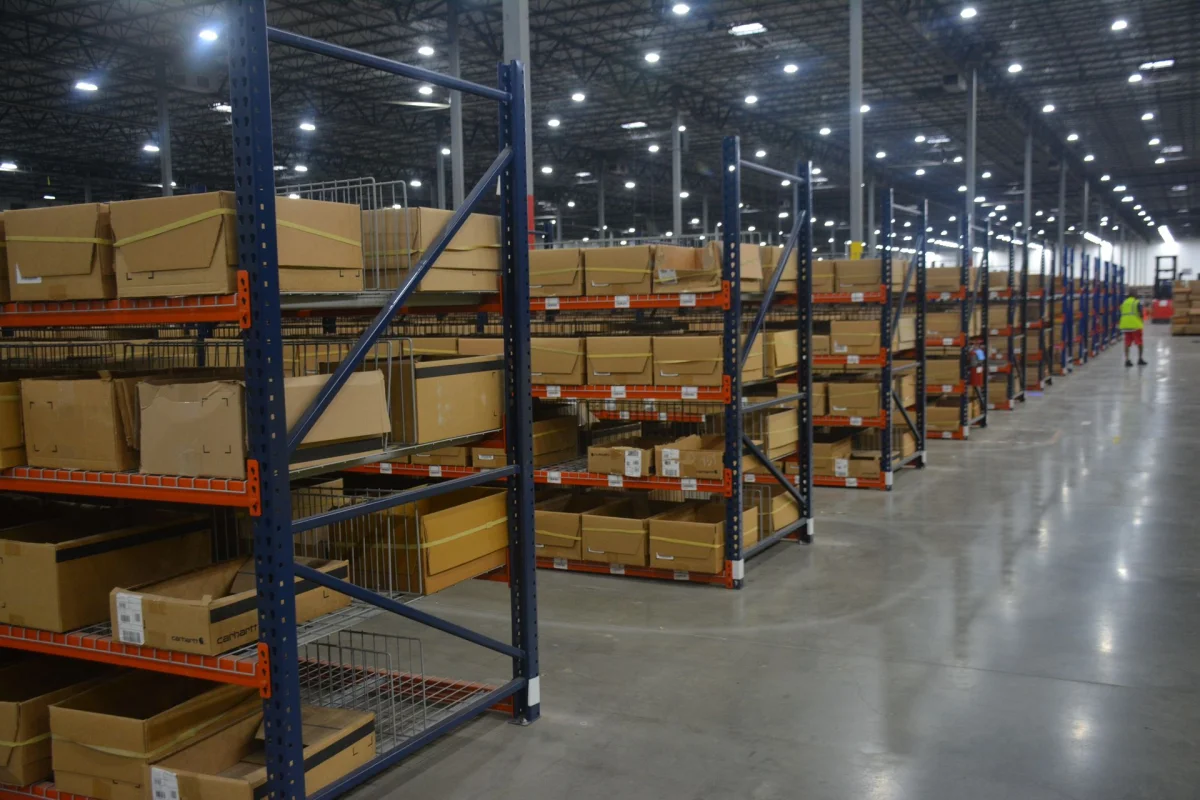
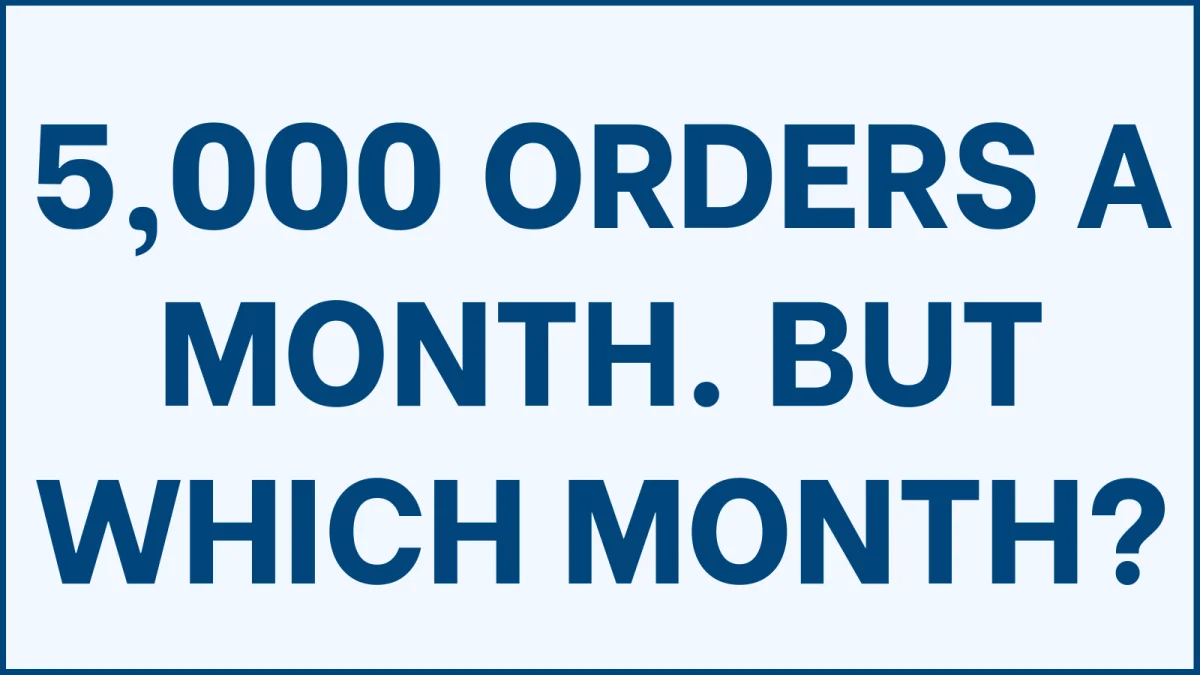
A monthly order average can make a fulfillment operation look steadier than it is. A brand shipping 60,000 orders a year averages 5,000 per month, but that figure doesn’t show whether volume arrives evenly or piles up around a few launches, promotions or seasonal peaks. For a third party logistics provider (3PL), the difference affects how it plans warehouse space, staffing and inventory handling.
That is the practical point raised by Harrison Smith, Director of Commercial Revenue at Barrett Distribution Centers, who has about 20 years of experience in the 3PL industry. When assessing a brand, he looks for the pattern behind its order count, not just the annual total. “When I work with brands, I wanna understand everything about the business,” he says.
One annual total, different warehouse demands
Consider two businesses that each ship 60,000 orders in a year. One might stay close to 5,000 orders every month. The other might handle a large share of its yearly volume during a few intense periods. Their annual totals match, but their operating needs may not: the second business can require more space, labor and handling capacity at specific times.
An average smooths those differences away. It tells a provider the broad scale of the business, but it doesn’t show when the operation has to speed up, how long a busy period lasts or how sharply activity changes from one month to the next. Smith says he examines yearly trends and asks what those peaks look like within the year.
The timing matters before orders start moving out the door. Inventory may need to arrive weeks or months before a sales surge, then be received, checked and positioned for fulfillment. That inbound flow puts pressure on warehouse space and receiving work ahead of the outbound peak. A plan based only on the month orders ship can miss the earlier work needed to make those orders possible.
Peak season depends on the product
Holiday demand is only one possible pattern. A swimwear brand may see its busiest stretch in warmer months. An apparel business may organize volume around seasonal collections or product launches. Promotions, large retailer orders and other sales events can also create short, sharp surges.
Smith asks brands when inventory needs to arrive to support their busiest selling period, whether that period falls during the holidays or in summer. The answer helps show how the business’s calendar affects warehouse activity. A large inbound delivery ahead of a peak needs storage space; a rapid increase in orders adds picking, packing and dispatch work. When a brand sells through several channels, each channel may contribute a different pattern to the overall demand profile.
This is why a useful history should show more than monthly totals. It should help explain the shape of demand: which periods were unusually busy or quiet, when inventory arrived, and whether a spike came from a promotion, a launch or a retailer order. Those details give a 3PL more to work with when assessing the operation it may need to support.
Context makes order data more useful
A past spike is easier to plan around when the brand can explain what drove it. Was it a one-time promotion, a recurring seasonal event or an order from a retail customer? The cause doesn’t guarantee the same pattern will repeat, but it helps distinguish a known part of the business from an unusual month that may need more discussion.
Smith describes himself as a “data nerd,” but the value of the numbers, in his view, is how they inform the conversation. “The better you understand the data, the better the quote we can offer,” he says. He also puts it simply: “the better the data, the better our pricing.”
If a provider receives only a partial account of the business, it has to make assumptions. Smith says those assumptions tend to be conservative because the provider doesn’t want to commit to an operation the available information can’t support. More complete records can make the estimate more specific by showing the provider what the average leaves out.
Share the operating pattern, not just the average
Average monthly volume is still useful as a starting point. It gives a quick sense of scale. But brands assessing fulfillment needs can make the discussion more grounded by showing busy and quiet months, explaining the events behind unusual spikes and outlining when inventory typically arrives ahead of a major selling period.
It also helps to flag uncertainty. If demand changes unpredictably, that fact is part of the operating picture a provider needs to understand. Likewise, if one large retailer order can alter the shape of a month, an average built from ordinary ecommerce orders won’t capture the work involved.
My read is that the useful planning question isn’t simply how many orders a brand ships in a year. It’s when those orders arrive, what activity precedes them and which parts of the pattern are likely to return. A more complete view of those details gives a 3PL a better basis for considering space, labor and service needs—and gives both sides a clearer picture of the business the warehouse is being asked to handle.
Barrett Distribution Centers’ contact page is available here.