Monday, November 2, 2026 · Trucking & Freight
SONAR Adds Lane-Level Mode and Rate Conversion Analysis to SCI Custom Insights
Noted by Julie Van de Kamp · 915 reads
SONAR’s new module compares truckload, intermodal, spot and contract options by lane, with adjustable volumes and estimated savings.
Shippers can use SONAR’s new Conversion Optimization module to compare transportation choices lane by lane, including truckload versus intermodal and spot versus contract. The module, added to Supply Chain Intelligence (SCI): Custom Insights in October 2026, uses each shipper’s freight data alongside SONAR market benchmarks to estimate potential savings.
The analysis includes three conversion views: truckload to intermodal, spot to contract and contract to spot. For each selected lane, users can compare their current rate with relevant SONAR rates, adjust the volume they want to evaluate and see estimated savings per lane and across the selected network. That makes the tool useful for building a partial conversion plan as well as identifying lanes for further review.
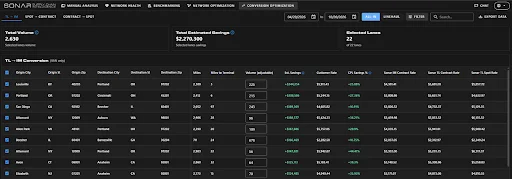
The Conversion Optimization view in SCI: Custom Insights has tabs for truckload to intermodal, spot to contract and contract to spot.
Three ways to assess a lane
The truckload-to-intermodal view flags lanes where rail intermodal may cost less than over-the-road truckload. It also shows the distance to the nearest rail terminal, giving planners a practical detail to consider alongside the rate comparison. Terminal proximity alone does not determine whether a lane is suitable; teams still need to assess service requirements and operating fit.
The other two views examine how freight is priced. Spot-to-contract highlights lanes where shipments repeatedly move on the spot market and a contract rate may be less expensive and more predictable. Contract-to-spot identifies lanes where the contracted rate is above the spot rate, indicating a possible opportunity to shift some volume to spot.
These comparisons give procurement and network teams a way to revisit established lane choices when market conditions change. The tool presents rates side by side, including the shipper’s current rate and SONAR’s intermodal contract, truckload contract and truckload spot rates. Which benchmarks appear depends on the conversion view.
Volume controls make the estimates adjustable
Users can set the volume they want to evaluate on each lane. If a team is considering moving only part of a lane’s freight to intermodal, for example, it can enter that planned share and see the revised estimated savings. The total recalculates across all selected lanes as users change the volumes.
That flexibility matters because a lane conversion can be staged. A shipper may want to test a limited share before expanding the change, or compare several possible volumes while preparing a rate review. The estimates help teams size those scenarios; they don’t, by themselves, establish that a service change will work operationally.
Users can also set a date range, select lanes and export data for bid planning or rate reviews. The combination of lane selection, adjustable volume and export gives teams a starting point for deciding which opportunities merit closer analysis and discussion with carriers or internal stakeholders.
Market changes can reopen earlier decisions
The relative cost of truckload and intermodal, like the difference between spot and contract pricing, can shift with market conditions. A comparison made during an annual sourcing process may therefore become less useful as rates change. SONAR presents Conversion Optimization as a way to review those choices between sourcing events, using current market benchmarks and the shipper’s own network data.
For planners, the practical question is whether a candidate lane fits the service and operating needs of the business as well as the estimated cost opportunity. Long-haul, high-volume lanes with flexible transit times are among the cases the source identifies for considering truckload-to-intermodal conversion. Teams can use the lane results to focus their review, then weigh the rate estimate against their requirements for each movement.
Part of SCI: Custom Insights
Conversion Optimization is the newest module in SCI: Custom Insights, which launched in September 2026. Custom Insights combines a shipper’s data from the SONAR Shipper Consortium with market benchmarks to show network performance. The new module applies that view to potential mode and pricing changes.
It joins other SCI tools and datasets. The platform includes a redesigned experience with a Risk and Efficiency Quadrant for RFP guidance, while Manual Analysis remains available for mini-bids, project freight and new lanes. SONAR also released Routing Guide Premium (RGP), Routing Guide Acceptance Share (RGAS) and Contract Rate Change Direction (CRCD) datasets alongside Conversion Optimization.
The intended users include procurement teams preparing RFPs, mini-bids or mid-cycle rate reviews; network planners evaluating intermodal options; finance teams estimating transportation spend; and logistics managers whose freight regularly falls to the spot market. The tool’s value for each team depends on the quality and relevance of its lane data and on how closely the selected scenarios match planned operations.
Access and next steps
Current SCI: Custom Insights users can open Conversion Optimization within Custom Insights in SONAR. Shippers outside the Shipper Consortium can ask their account manager about contributing data. SONAR also offers a demo request for prospective users.
For shippers, the immediate use is to identify lanes where a different mode or pricing approach could merit review, then test the estimated impact at a chosen volume. The results give teams a structured way to compare options across their network as rates and operating plans change.
The post SONAR SCI: Custom Insights Now Includes Conversion Optimization: Shows Shippers Where to Switch Modes and What They Can Save appeared first on FreightWaves.