Sunday, November 1, 2026 · Trucking & Freight
Cass Freight Indexes Show Why Freight Cycles Resist Simple Timelines
Noted by Zach Strickland, FW Market Expert & Market Analyst · 899 reads
Cass data traces distinct freight cycles since 2000; weak demand and rising rates now complicate expectations for the current upturn.

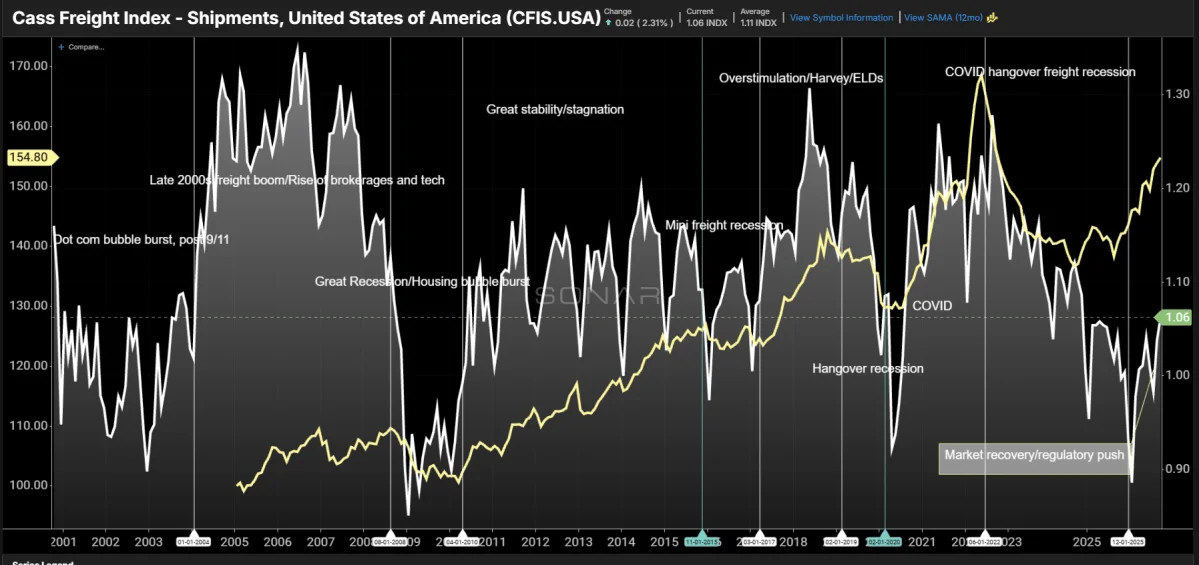
Freight cycles don’t follow a dependable calendar. Data from the Cass Freight Shipments Index (CFIS) and Cass Truckload Linehaul Index (CTLI) show that domestic demand and truckload base rates have responded to shifting economic conditions in different ways since 2000. For shippers and carriers planning around the current cycle, the record argues against assuming that a familiar pattern will return on schedule.
The CFIS tracks shipments across truckload, intermodal, less-than-truckload and smaller transportation modes. Built from invoice data, it offers a broad view of freight demand, though the figures arrive with a slight lag. The CTLI measures the base cost of truckload moves, excluding fuel and accessorial charges. That makes it a useful measure of linehaul rates and of the balance between truckload capacity and demand.
Chart of the Week: Cass Freight Shipments Index, Cass Truckload Linehaul Index – USA SONAR: CFIS.USA, CTLI.USA
Demand and capacity shift through successive cycles
The early 2000s brought a downturn after the dot-com collapse and the economic effects of 9/11. Freight shipments stayed subdued even after the wider economy began recovering. A sharp change came in 2004, when real GDP grew about 3.8%. Low interest rates helped drive a housing boom, while strong goods demand met limited transportation capacity.
That tight market helped freight brokerage expand beyond its traditional role of finding backhauls. More accessible internet technology connected smaller carriers with larger shippers, supporting the growth of brokerages and owner-operators. Volatile fuel prices added another operating challenge, but the core market signal was a shortage of capacity relative to goods demand.
The housing collapse in 2008 brought a much deeper contraction, with weakness lasting into 2010. The economy then recovered gradually. From 2011 through the middle of the decade, freight experienced its steadiest period in the data. CFIS volumes followed a clear annual seasonal pattern, while truckload base rates increased about 3% per year. That stretch came to define what many in the industry considered normal.
The apparent steadiness broke in late 2015, when energy markets fell. Industrial activity weakened, and economic growth slowed from roughly 4% in early 2015 to 1.5% a year later. Demand softened and truckload base rates declined about 2% during the 2016 freight recession. Many participants recognized the downturn only after it was underway.
A fast tightening gave way to a capacity surge
By early 2017, demand was returning as available capacity tightened. A strong spot-rate upswing followed, lasting into 2018. Hurricane Harvey and the electronic logging device mandate further constrained operations during the fall and winter of 2017. The speed and scale of the increase led some market participants to treat it as an exceptional event unlikely to recur.
But rapid expansion drew more trucks into the market. Strong rates attracted new entrants, and active trucking authorities increased about 15% from early 2017 to early 2019. The economic boost faded, demand weakened and the market contracted. In 2019, carrier failures included truckload operator Celadon and less-than-truckload carrier New England Motor Freight, then among the largest trucking shutdowns of the century.
That capacity exit mattered when the next demand surge arrived. The COVID-era shock brought a sharp increase in goods purchases as stimulus, enhanced unemployment benefits and work-from-home arrangements changed household spending. The resulting demand boom collided with supply chain disruptions, leaving freight markets far outside the steadier pattern of the prior decade.
The current cycle resists a neat forecast
The downturn that followed began in early 2022 and continued through the 2025 holiday season, making it the longest freight recession of the 2000s. The market is now approaching a year into a new cycle, but the indexes offer little basis for assigning it a reliable end date. The history shows that each cycle has its own mix of demand, capacity and outside economic pressures.
Several factors are shaping the present market, including higher barriers to entry, diesel prices and interest rates. Demand remains relatively weak, a difficult combination to square with rising rates. In September, the CTLI showed rates up 10%, while shipment volumes rose only 2%. Those figures point to a market in which pricing and freight activity are moving at different speeds.
For planning teams, the practical lesson is that freight does not operate in isolation from the broader economy. The comparatively stable conditions from 2010 to 2015 may not be a sound baseline for budgets or capacity decisions. Historical patterns can help frame scenarios, but they don’t provide a dependable timetable.
Twelve months is at the low end of the historical range for a cycle’s duration. Demand remains near the bottom of its range, and an unexpected improvement in economic activity could extend the current upswing by several months. A forecast for rates to ease quickly also assumes a broader slowdown, which could weigh on business revenue. The useful focus for finance and operations teams is the relationship between shipment volumes, base rates and available capacity as the cycle develops.
About the Chart of the Week
The FreightWaves Chart of the Week selects a chart from SONAR to illustrate a current freight market data point. A Market Expert shares a chart and commentary on the site each week; the selection is then archived for future reference. The charts are chosen from thousands of available views to help industry participants track freight conditions.
SONAR brings together data from hundreds of sources in charts and maps, with commentary on the questions freight market professionals are following. FreightWaves’ data science and product teams release new datasets each week and update the client experience. To request a SONAR demo, click here.
The post Freight cycles are anything but regular appeared first on FreightWaves.