Sunday, October 25, 2026 · Trucking & Freight
Truckload Contract Rate Changes Hold Above 10% as Shippers Reset Agreements
Noted by Zach Strickland, FW Market Expert & Market Analyst · 776 reads
SONAR’s index reached 13.11% on Oct. 22, while tender rejections near 13% point to continued pressure on truckload contracts.

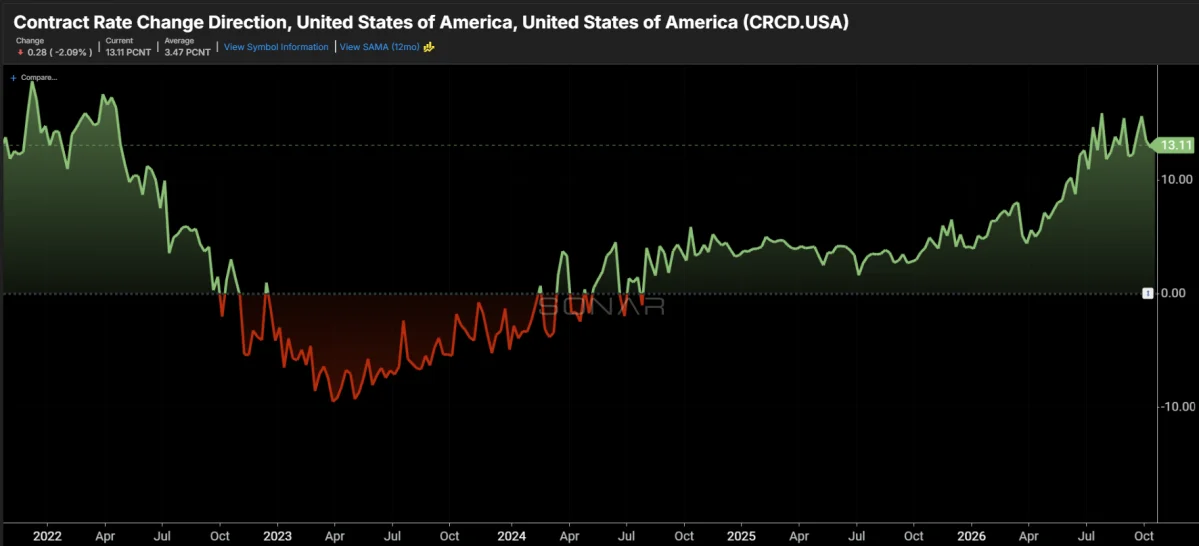
Truckload contract resets are still bringing double-digit increases for shippers. SONAR’s Contract Rate Change Direction index for the U.S. (CRCD.USA) reached 13.11% on Oct. 22, compared with 3.53% a year earlier. The reading indicates that when established shipper-carrier contracts change, new base rates are averaging about 13% above the rates they replace.
That figure describes the size of changes being made, not a year-over-year increase across all contracted freight. CRCD.USA tracks the average percentage difference between a new contract base rate and its predecessor within an existing shipper-carrier relationship. A rate change enters the index only after the previous rate has held for more than 90 days. That threshold is intended to capture bid-cycle repricing rather than brief adjustments.
What the index captures
SONAR publishes CRCD.USA as a daily updated, seven-day rolling average. It excludes effects from temporary route guide waterfalling and contract-plus pricing, which can raise a shipper’s near-term costs when a primary carrier declines a load and freight moves to another option in the routing guide. The index instead focuses on changes to contract base rates that have been in place long enough to qualify.
That distinction matters when comparing contract negotiations with invoices. A shipper may see higher costs when loads fall through the routing guide, even if its base contract rate has not changed. Those movements reveal pressure on available capacity, but they can overstate the lasting cost if they are treated as a settled contract reset.
CRCD.USA also counts only contracts that change. It does not weight its reading by the volume moving under each agreement, so the index can be less representative when relatively few contracts are being reset. Nor does it track whether a carrier’s position in a shipper’s routing guide changes after a new rate takes effect. These limits mean the index is best read as a measure of repricing activity among changing contracts, not as a direct measure of every shipper’s average freight bill.
Resets and invoices tell different parts of the story
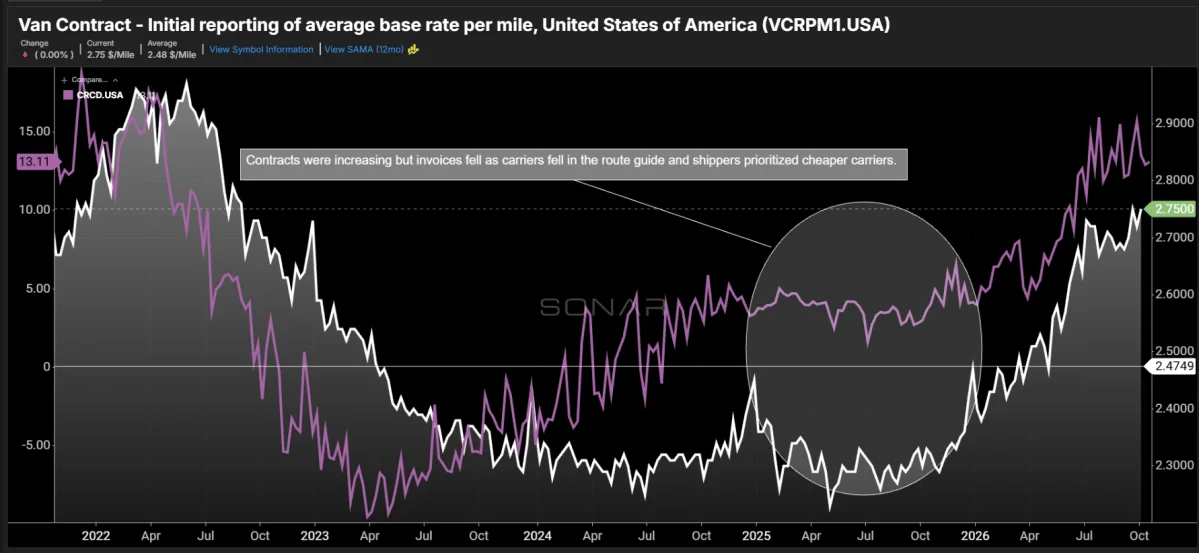
The difference between contract resets and invoiced rates was visible in 2025. Beginning in late 2024, contract changes ran at roughly 3% to 4%, while SONAR’s average contract rate index, VCRPM1, showed invoiced rates flat to slightly lower through most of the year. A higher replacement rate, on its own, doesn’t show how much freight moves under that agreement or where the carrier sits in the routing sequence.
Reading CRCD.USA alongside VCRPM1 gives shippers a fuller view: one index shows the direction and size of changes when contracts reset; the other helps show whether those changes appear in average invoiced rates. CRCD tends to lead invoice data directionally, but it does not establish whether a negotiated increase will persist. Carriers sought higher rates a year before the current increase cycle gathered strength, a reminder that negotiation pressure and realized invoice costs can diverge.
Rejections preceded the rate increases
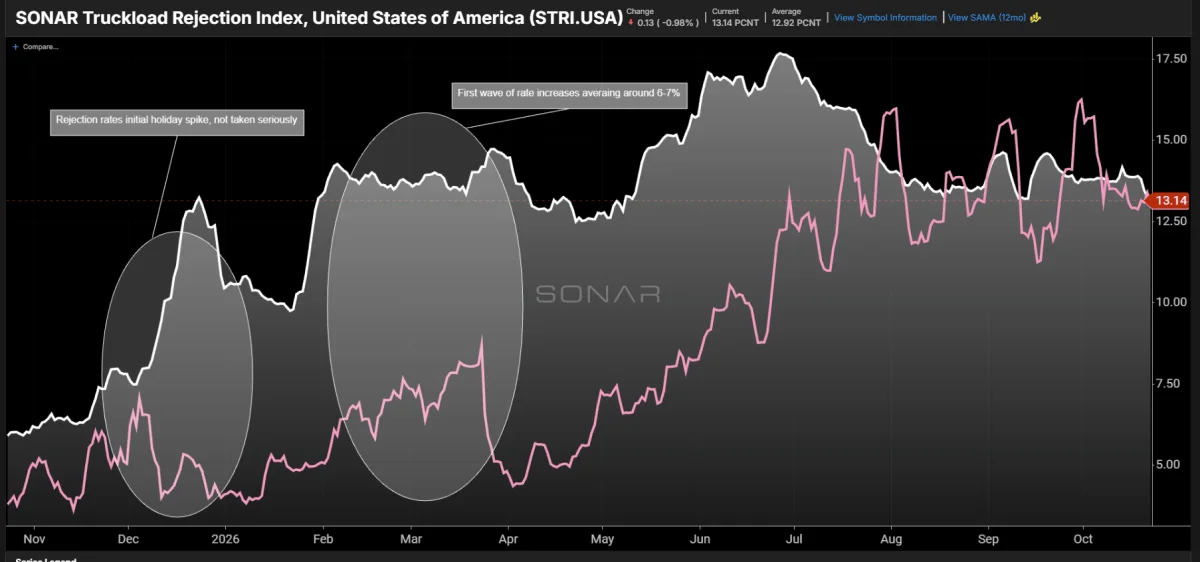
The current 13.11% reading follows a rise in tender rejection rates above 9% nearly a year earlier. In the pattern described by the chart, contract changes lagged those rejections: rates moved up after rejection levels stayed elevated, rather than immediately when carriers began turning down more tenders. Tender rejection rates averaged close to 13% over the past few months, while new contract changes continued to come in above 10%.
CRCD.USA is not an annualized rate. It reports the average increase or decrease when a contract changes, and the change appears only once it has been implemented. A 13.11% reading therefore should not be interpreted as every shipper paying 13.11% more across its entire truckload portfolio, or as a forecast of the next 12 months.
For procurement teams, the practical signal is that carriers are still winning substantial increases on agreements that reset. VCRPM1 suggests those increases are showing up in invoiced rates. The average increase may moderate as carriers move onto contracts they consider more financially sustainable, but the timing depends on how quickly contract resets work through the market.
Capacity is another part of that timing. The source’s review of FMCSA and tender data indicates capacity has not grown meaningfully over the past 12 months despite higher rates. If that pattern continues, the pressure behind current negotiations could take time to ease. Shippers comparing bids with invoice trends should keep the reset index, invoice index and tender conditions in view together; each describes a different stage of the rate cycle.
About the chart
FreightWaves’ Chart of the Week selects a chart from SONAR to illustrate a current freight-market data point. The chart is chosen from thousands available on SONAR, then accompanied by commentary from a market expert and archived on FreightWaves.com.
SONAR combines data from hundreds of sources and presents it through charts, maps and market commentary. FreightWaves’ data science and product teams release datasets and make changes to the service over time. A demo can be requested here.
Chart of the Week: Contract Rate Change Direction Index – USA SONAR: CRCD.USA
The post Truckload contract rate increases riding steady above 10% appeared first on FreightWaves.
===END===