Sunday, October 11, 2026 · Trucking & Freight
Northwest Reefer Surge and Midwest Freight Tightness Split the Truckload Market
Noted by Zach Strickland, FW Market Expert & Market Analyst · 857 reads
SONAR puts Northwest tender rejections at 20.27% and Midwest at 18.61%, driven by different freight and capacity pressures.
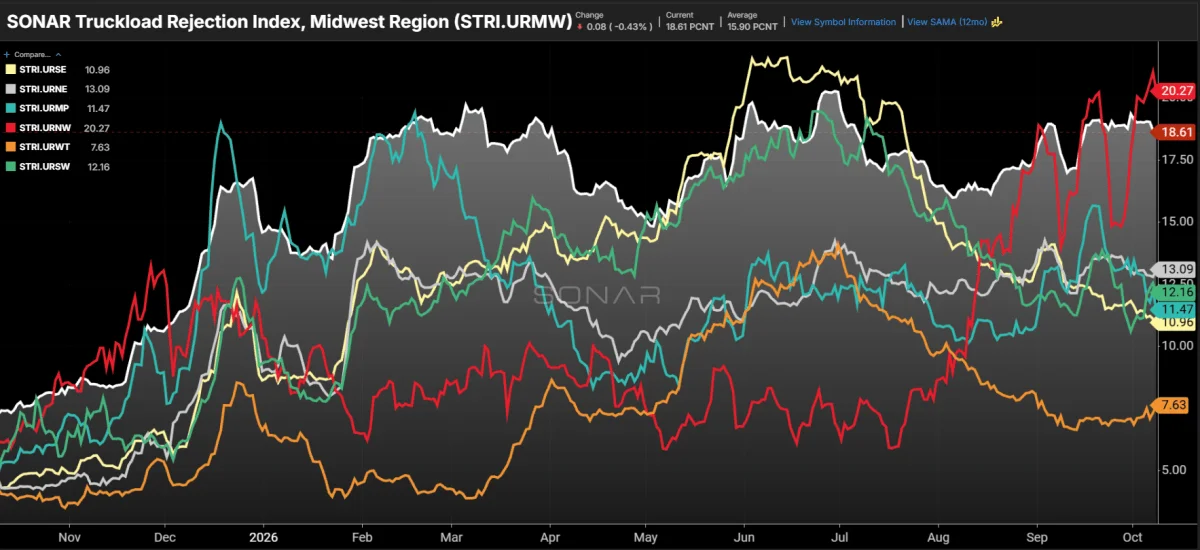
The Northwest and Midwest are the country’s tightest large freight regions, but the pressure looks different in each. SONAR’s regional tender rejection data put Northwest rejections at 20.27% on Oct. 8, more than triple the 6.2% recorded a year earlier. The Midwest was close behind at 18.61%, with elevated readings across both van and refrigerated freight.
The national tender rejection rate eased to about 13.8% over the past two weeks, according to SONAR. That average masks a sharp regional split: every other region was between 7.6% and 13.1%, holding steady or moving lower. For shippers, the distinction matters. Northwest pressure is concentrated in refrigerated capacity during harvest, while Midwest tightness spans equipment types and comes alongside growing freight volume.
Chart of the Week: SONAR Regional Tender Rejection Rates: STRI.URMW, STRI.URNW, STRI.URSE, STRI.URSW, STRI.URNE SONAR chart
Northwest capacity is under pressure from harvest freight
The Northwest was among the looser regions for much of 2026. Rejections stayed between 6% and 9% from January through July, then nearly doubled during August and climbed in almost every week that followed. October’s equipment-level data point to refrigerated freight as the main source of the surge.
Northwest reefer rejections averaged 41% so far in October, compared with about 17% in July and 16% in October last year. Van rejections, by contrast, are below 5%. Reefer tender volume has risen 65% since July and is up 35% year over year, while van volume is down 11% from a year ago. In practical terms, the region has more refrigerated loads competing for available trucks, while its van market is much looser.
The timing lines up with the fall apple and potato harvests in Washington, Oregon and Idaho, which ramp up from late August through October. That produce moves almost entirely in refrigerated trailers. The seasonal pattern also appeared last year, but later and with less intensity: Northwest rejections did not top 10% until mid-November and peaked near 13%.
A larger apple crop does not account for this year’s tighter market. The source reports a 2026 Washington crop estimate of 176.2 million bushels, down 2% from last year, and a national crop estimate down 7%, citing The Packer. The higher rejection rate alongside lower crop estimates suggests that seasonal demand is meeting a thinner available fleet. The data do not, on their own, identify how much of the change comes from each factor.
Capacity planning helps explain why a harvest can produce a sharp regional swing. Carriers may limit contract commitments in a region that generates relatively little outbound freight for much of the year, since trucks can be difficult to reposition out of it. When seasonal refrigerated loads arrive, the fleet already in place may not be enough to cover demand. The source expects this Northwest effect to fade as harvest activity winds down this winter.
Midwest tightness reaches across equipment types
The Midwest’s pressure has lasted longer and is broader. Its rejection rate has remained near or above 15% since February and reached 18.61%, compared with 7.6% last October. Regional tender volume is up about 10% year over year, ahead of the 8% national increase.
Van rejections in the Midwest are near 15%, about two and a half times last year’s level. Reefer rejections are near 29%, up from 15%. That spread across equipment types suggests the region’s difficulty covering contracted loads cannot be explained by a refrigerated harvest surge alone. The reported volume growth adds another source of pressure: more freight is seeking capacity while carriers are rejecting more tenders.
The Midwest is the country’s largest freight region, making its sustained readings more consequential to the national picture than a brief, equipment-specific spike. Its rejection rate is about five percentage points above the national figure, and the source says it has shown little improvement even as the national market eased. Shippers moving freight through the region will need to read the broader trend alongside their own lanes and equipment needs; the regional average does not describe every individual route.
Intermodal activity offers another regional signal
In the Southeast and Southwest, shippers have turned to domestic intermodal. Volume through the Atlanta and Dallas hubs was up 15% to 20% year over year in the past week, according to the source. The shift began over the summer, when tender rejections in those regions peaked. That sequence points to intermodal as an option shippers have used amid tight truckload conditions, though the figures provided do not establish how much freight moved from truck to rail.
For freight teams, these readings call for different regional questions. In the Northwest, the key variable is how long seasonal reefer demand outlasts the capacity positioned for the harvest. In the Midwest, elevated rejections across vans and reefers, alongside faster-than-national volume growth, make persistence the central concern. National averages can show the direction of the market, but equipment-specific and regional data reveal where coverage is getting harder.
The chart is selected from SONAR, which aggregates data from hundreds of sources into freight market charts and maps. The chart series includes regional rejection measures for the Midwest, Northwest, Southeast, Southwest and Northeast. More information about the data platform is available at SONAR; a demo can be requested here.