Tuesday, October 13, 2026 · Trucking & Freight
SONAR PPI Falls to 70 as Intermodal Contract Rates Weigh on Freight Pricing Power
Noted by Julie Van de Kamp · 881 reads
SONAR’s PPI fell for a fourth week, but a 70 reading still favors carriers as tender rejections hold near 13.9%.
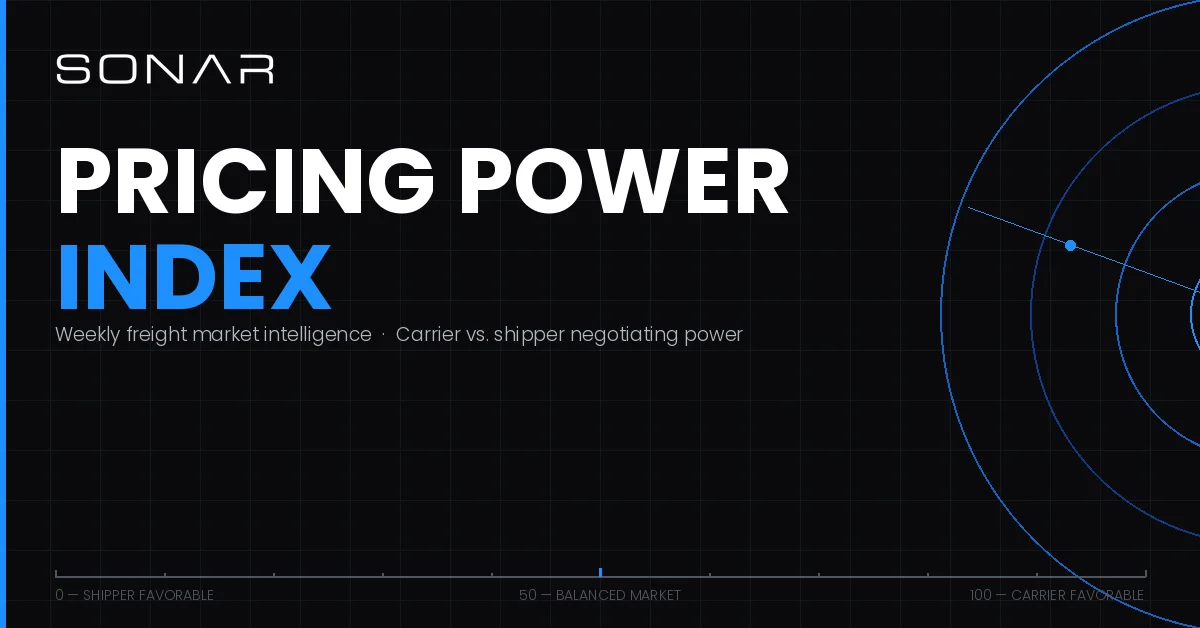
Carrier pricing power eased for a fourth consecutive week, but the latest SONAR Pricing Power Index still points to a market tilted toward carriers. The PPI slipped to 70 for the week of Oct. 12, 2026, from 71. Lower intermodal contract rates and softer ocean import bookings drove most of the decline, while truckload tender rejections remained nearly unchanged.
The index uses a 0–100 scale, with 50 representing a historically balanced market. At 70, it remains well above that midpoint. For shippers, the weekly drop signals some relief in the indicators behind carrier leverage, but the broader reading still suggests carriers retain an advantage in rate negotiations as the fourth quarter progresses.
Intermodal and ocean bookings lead the decline
Intermodal contract rates were the largest drag on the weekly score. They fell to $1.61 per mile from $1.68, moving from the 54th percentile to the 36th percentile of their five-year weekly history. That change alone took roughly 0.9 points off the PPI.
Ocean import bookings also weakened. They slipped about 2%, falling from the 56th percentile to the 48th and subtracting roughly 0.6 points. Together, those two measures accounted for about 1.5 points of downward pressure.
Several smaller gains offset part of the decline. Van contract rates, the spread between spot and contract rates, tender rejections and accepted truckload volume all edged up. Taken together, those improvements recovered about half a point. The net result was a one-point drop in the headline index.
Capacity remains tight relative to recent history
The national truckload tender rejection rate, identified as STRI in the report, was 13.85%, compared with 13.84% the previous week. Rejections have stayed in a range of roughly 13.3% to 14.4% since early August. The current reading is below the 17% to 18% peak reached in late June, yet it remains more than two and a half times the level recorded two years ago.
The rate is in the 83rd percentile of its five-year history. That measure helps explain why the overall PPI still favors carriers: a sizable share of tendered freight is being rejected relative to typical levels, even though rejections have eased from the summer high. SONAR’s three-month model points to a further increase rather than a prolonged stretch at current levels.
Rail volumes stay high as truckload activity remains soft
Rail volume dipped less than 1% to 35,575 loaded containers but remained in the 99th percentile. The source attributes the elevated rail activity to continued truck-to-rail conversion, with freight shifting to rail on lanes of roughly 550 to 1,500 miles as truckload carriers become more selective about the loads they accept.
Accepted truckload volume rose about 1% for the week, but the measure remains near the bottom of its range, at the 13th percentile. That combination matters for the market read: rail activity is exceptionally high by historical comparison, while accepted truckload volume remains weak. Ocean import bookings also softened, though they continue to run above last year’s levels.
Contract rates are rising while spot rates ease
Van contract rates increased to $2.74 per mile, placing them in the 84th percentile. The upward move reflects carriers repricing contracts. Meanwhile, the national spot rate eased to $3.52 per mile from $3.56. It remains in the 95th percentile and close to July levels, according to the report.
The spot-contract spread narrowed to negative $0.11 from negative $0.15. It has remained below zero since mid-September, after spot rates retreated from an early-July peak of $3.80 per mile while contract rates continued to climb. The narrowing spread shows those two rate measures moving closer together, even as spot pricing remains high in historical terms.
Three-month outlook remains above the current reading
SONAR’s three-month PPI outlook fell to 76 from 79, giving back most of the previous week’s increase. The forecast remains six points above the current index reading of 70. Its component projections place tender rejections in the 93rd percentile by mid-January, with spot rates and rail volume at the top of their historical ranges.
That outlook points to a possible strengthening of carrier leverage later in the period, although the current weekly data show the PPI edging down. The key measures to watch are rejections, contract pricing and whether elevated rail volumes continue alongside subdued accepted truckload volume. The report provides a metric-by-metric account of the three-month outlook.
How the index is built
The SONAR Pricing Power Index is a weekly composite intended to show whether carriers or shippers have greater negotiating leverage in the U.S. freight market. It combines eight measures: tender rejections, accepted volume, rail volume, ocean TEU bookings, spot rates, van contract rates, the spot/contract spread and intermodal contract rates.
Each measure is ranked against its own five-year weekly history, then weighted into a score from 0 to 100. A reading of 50 represents a historically balanced market; higher scores favor carriers, and lower scores favor shippers. The latest reading therefore shows a market that has softened at the margin while remaining on the carrier-favorable side of the scale.
The complete SONAR Pricing Power Index report includes charts and analysis of all eight measures and the three-month outlook. It is available through SONAR Research and FreightWaves Market Monitor. Readers seeking additional data can request a SONAR demo.
For shippers and carriers, the immediate takeaway is the divide between the weekly direction and the market’s broader position: the PPI has fallen for four straight weeks, but at 70, its capacity and pricing indicators still favor carriers.