Sunday, October 18, 2026 · Trucking & Freight
Truckload Capacity Remains Tight as Accepted Loads Fall
Noted by Zach Strickland, FW Market Expert & Market Analyst · 475 reads
Accepted SONAR truckload volumes have fallen while rejections remain near 13.9%, pointing to limited capacity and rising cost pressure.
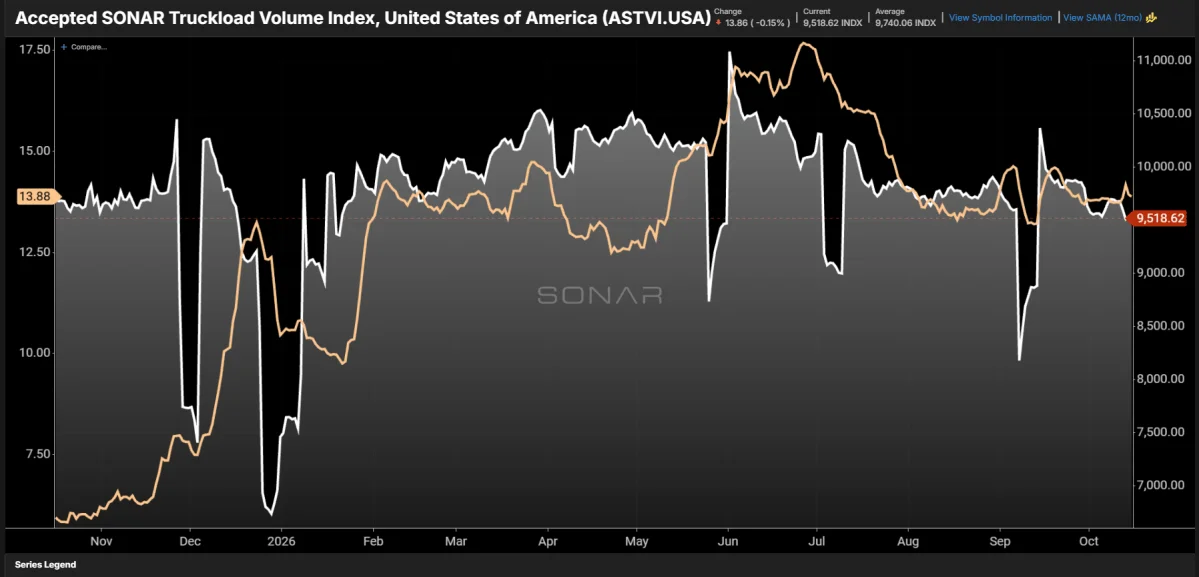
Truckload capacity shows little sign of loosening: accepted load volume has declined, yet carriers are still turning away a notable share of tenders. The Accepted SONAR Truckload Volume Index (ASTVI) fell more than 4% in four weeks to 9,518, its lowest reading outside a holiday week since January. Meanwhile, the SONAR Tender Rejection Index (STRI) remains near 13.9%. For shippers, the combination points to a market with less available room than the accepted-load figure alone might suggest.
The measures track different parts of the market. ASTVI counts loads carriers accept, while STRI reflects the share of tendered freight carriers reject. A lower accepted volume can indicate fewer loads moving through the measured network, but it doesn't automatically mean that carriers have spare capacity. With rejections holding near 13.9%, the latest figures offer little evidence that capacity is returning in step with the drop in accepted loads.
The year-over-year comparison adds to that picture. At this point last year, rejections were below 6%, while accepted volume was about 2% higher. That gap suggests the market has made little progress toward greater efficiency over the past year, despite a lower ASTVI today. The current conditions also differ from the early COVID surge, when accepted volume peaked around 11,500 in fall 2020 and rejection rates approached 25%.
Two different capacity cycles
The COVID-era cycle began with a powerful rise in demand. From September 2019 to September 2020, tender volumes climbed nearly 50% year over year, and accepted volumes increased 20%. That growth rapidly consumed slack in a market that had previously carried excess capacity. By spring 2021, carriers were accepting more than 10% additional loads, even as rejection rates remained high. The market was tighter than today's, but the higher accepted volume showed that freight activity had expanded substantially.
The current tightening has taken a different path. It became visible during the 2025 holiday season, when tender rejections and spot rates ran well above their levels in the previous three years, even though trucking demand was weaker. Winter Storm Fern, in late January, added another push to rejections and spot rates. Neither measure has meaningfully retreated since, according to the source data. The article attributes this cycle primarily to limited capacity rather than a broad surge in freight demand.
That distinction matters for transportation planning. When demand rises sharply, capacity can be absorbed by more freight moving through the network. When available capacity contracts, a similar level of shipper demand can encounter tighter tender acceptance and higher spot prices. The SONAR measures don't establish what any individual shipper will pay or whether a particular lane will have trucks available, but they offer a national view of the strain in the market.
Fewer paths into the driver pool
The source points to several factors that may restrict the supply of drivers and carriers. It cites enforcement of English-language proficiency requirements, tighter rules for non-domiciled commercial driver's licenses, and changes to immigration rules as barriers for potential drivers. These conditions can limit how quickly the industry adds capacity when demand or operating needs change.
It also describes an indirect effect from the Montgomery v. Caribe ruling: brokers are less likely to work with carriers that have poor safety records. GenLogs reported that, as of the previous summer, close to 2% of carriers with substandard safety scores had been removed from service. That figure gives a sense of the capacity affected by safety-related carrier changes, though it doesn't quantify the resulting effect on any particular lane or shipper.
Fuel and financing add pressure
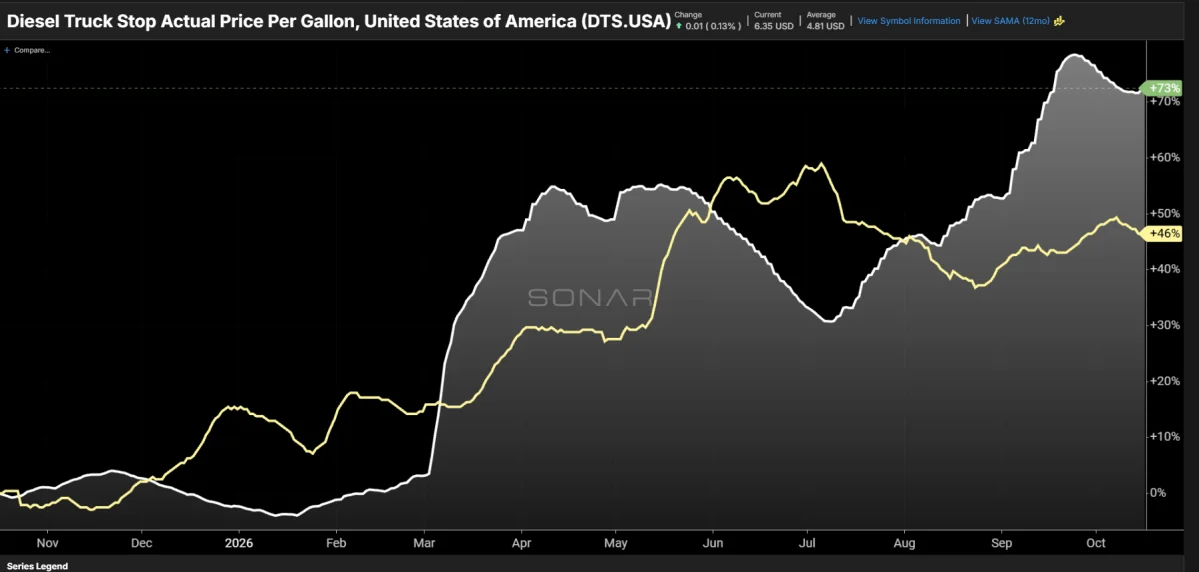
Operating costs are another constraint, especially for smaller carriers managing cash flow. Retail diesel prices are up 73% year over year, while dry van spot rates have risen 43%. Spot rates are up substantially, but they've failed to keep pace with fuel in recent months. That spread can leave carriers with less margin to cover other expenses or invest in equipment and growth.
The cost backdrop contrasts with 2020, when diesel prices fell. Today's carriers also face higher borrowing costs, and the low-cost lending that supported some operators during the COVID period is no longer available. Carriers that survived the difficult stretch from mid-2022 through late last year may be reluctant to expand while financing is expensive and profitability remains under pressure. Capacity can take time to respond even when freight conditions strengthen, and these constraints may slow that response.
For procurement teams, the practical signal is to plan around capacity that may remain constrained beyond a short seasonal bump. The source expects the market to stay tighter for longer, potentially into 2027, even as economic concerns persist. ASTVI and STRI are broad indicators; shippers still need to assess their own lanes, tender acceptance and carrier coverage. Together, though, the figures show why a decline in accepted loads hasn't yet translated into a clear recovery in truckload capacity.
About the chart and data
The Chart of the Week highlights selected freight-market data from SONAR. The chart referenced here tracks accepted truckload volume and tender rejections through the series SONAR and ASTVI.USA, STRI.USA. SONAR combines data from hundreds of sources in charts and maps designed to show freight-market conditions. Readers can request a SONAR demo.