Monday, November 9, 2026 · Trucking & Freight
SONAR Adds Flatbed and LTL Data to National Insights Dashboard
Noted by Julie Van de Kamp · 603 reads
SONAR’s updated dashboard adds flatbed and LTL views, giving subscribers national data on rates, capacity, volumes and market trends.
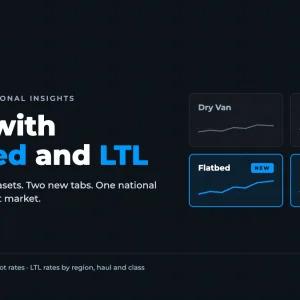
SONAR’s National Insights dashboard now brings flatbed and less-than-truckload data into its national freight view. For shippers, brokers and carriers, the change puts several market measures in one place, including flatbed tender rejections, LTL rates by freight class and historical trends. The dashboard also uses SONAR’s new blended datasets.
The update adds Flatbed and LTL tabs to Truckload National Insights. Users can access a pre-built national view without entering tickers, while Actionable Insights continues to provide a plain-language summary of what the data indicates. The dashboard covers truckload, flatbed and LTL; the source does not describe changes to the truckload measures themselves beyond the new blended datasets.
What the new tabs show
The Flatbed tab combines measures of freight activity, capacity, fuel and pricing. Users can view tender rejections and volumes alongside fuel and spot rates. It also includes Weekly Top Moving Markets and the TRAC Spot Market Conditions Map, adding market-level views to the national dashboard.
That mix can help users compare signals that may point in different directions. For example, the tab presents rejection and volume measures alongside spot pricing, allowing a team to review those indicators together when assessing flatbed conditions. The source provides no specific rates, volumes or market movements, so the dashboard’s value here is the set of measures it brings together, rather than a stated change in current conditions.
The LTL tab organizes rates by region, length of haul and freight class. It also offers regional comparisons, identifies top rate movers and includes historical trends. Those views give users several ways to examine LTL pricing: across geography, by shipment characteristics, and over time.
For procurement teams, that detail can support a more specific discussion than a single national rate figure. A comparison by freight class or length of haul can help frame how a rate view relates to the freight being moved. Historical trends add a reference point for considering whether a current movement is new or part of a longer pattern. SONAR does not provide example rate changes or describe the underlying time periods in the source material.
Why a multi-mode view matters
Flatbed and LTL can move on different cycles from dry van, according to the source. Flatbed activity is linked with industrial output and construction, while LTL pricing tends to lag truckload. A dashboard that places these modes side by side may therefore help teams notice when their signals diverge instead of assuming one mode represents the broader market.
That distinction is useful when people responsible for pricing, purchasing or equipment deployment need to discuss more than one freight segment. A shipper preparing for bid or budget conversations can use flatbed and LTL measures as benchmarks. A broker can review flatbed capacity signals and spot rates when pricing loads. A carrier can consider the same market context when deciding where to deploy flatbed equipment or when to seek higher rates.
These are uses for the information, not guaranteed outcomes. The dashboard supplies market indicators and summaries; teams still need to connect them to their own lanes, freight mix and operating decisions. National measures can provide a broad read, while the tab’s regional and shipment-level breakdowns help users inspect differences within LTL.
How subscribers access the dashboard
National Insights is a pre-built page within the SONAR platform for subscribers. It summarizes national freight conditions across areas such as capacity, demand, rates and fuel, with plain-language analysis and no ticker entry required. SONAR says subscribers can find the new Flatbed and LTL tabs in Truckload National Insights today.
The update’s practical effect is a wider set of mode-specific signals in a familiar national view. Users can look at truckload, flatbed and LTL data within the dashboard, then use the new breakdowns to guide questions about pricing, capacity and market differences. The source does not specify which metrics make up the blended datasets or how those datasets are constructed.
For teams that follow more than one freight mode, the next useful step is to compare the dashboard’s measures with the lanes and freight characteristics that matter to their operation. SONAR subscribers can review the updated tabs in the platform. Readers who want to see the dashboard can request a SONAR demo.
The post SONAR National Insights Expands With Flatbed and LTL Data appeared first on FreightWaves.
===DONE===