Sunday, November 8, 2026 · Trucking & Freight
Intermodal Contract Rates Rise as Fuel Surcharges Drive Most of the Increase
Noted by Zach Strickland, FW Market Expert & Market Analyst · 595 reads
Intermodal rates climbed year over year, with fuel accounting for most of the gains; the mode still offers a 30% average savings over comparable truckload lanes.
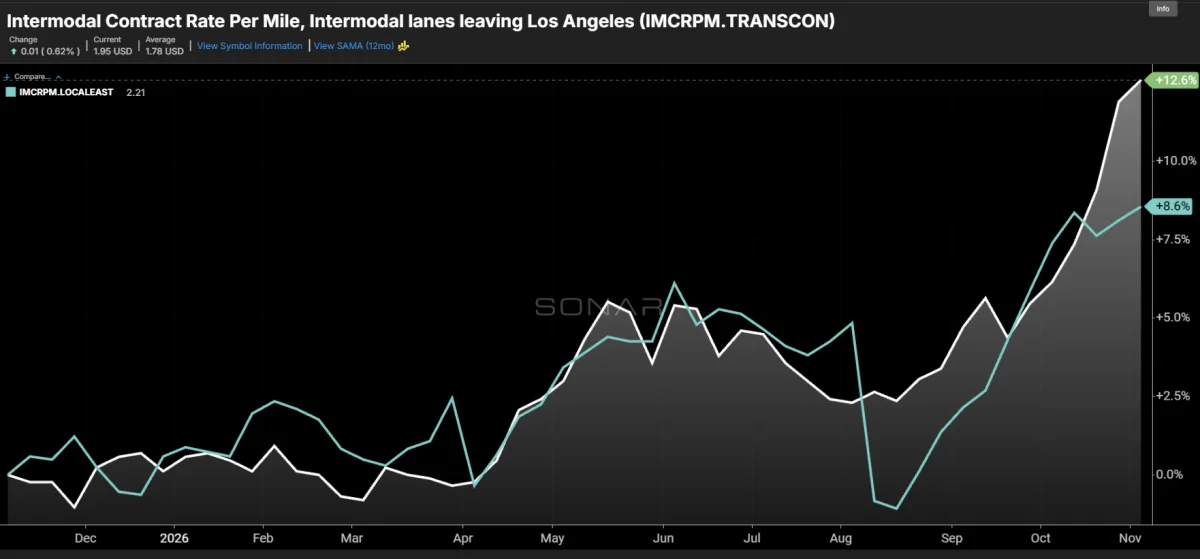
Intermodal’s rising contract rates look less like a broad jump in underlying transportation costs and more like a delayed response to diesel prices. In the fourth quarter, rates that include fuel surcharges rose more than 12% year over year on transcontinental lanes and nearly 9% on shorter Eastern lanes, based on FreightWaves SONAR indices. Even after those increases, the average intermodal rate advantage over comparable truckload lanes remains substantial.
The figures come from SONAR’s Intermodal Contract Rate per Mile indices for transcontinental and Eastern lanes, IMCRPM.TRANSCON and IMCRPM.LOCALEAST. They use invoices that include fuel surcharges. Since invoice records trail the freight movement by a few weeks, diesel changes take time to appear in the rate data.
That delay helps explain the sharp moves. Diesel prices rose about 50% in March and April; the transcontinental contract index then gained 6% from April to May. A diesel increase of roughly 36% from July through September was followed by a 10% rise in the index from August to October. The timing and scale of those changes point to fuel as a major force behind the recent rate increases.
Fuel explains most of the measured increase
Based on the indices’ relationship with diesel, fuel appears to account for roughly two-thirds of the transcontinental increase and three-quarters of the Eastern increase. Once fuel is excluded, the year-over-year gains are about 5% for transcontinental lanes and 2% for Eastern lanes.
A commonly published intermodal fuel surcharge schedule would imply a still larger fuel contribution—more than the entire increase recorded in either index. That gap suggests many large shippers have negotiated less aggressive surcharge tables of their own. The distinction matters in contract talks: the rate shippers and providers negotiate is the total charge, including fuel, while an index’s movement can reflect changes in both the base rate and the surcharge.
J.B. Hunt, one of the largest intermodal providers, said it won low-single-digit rate increases in the bid season that ended in September. That result is consistent with the index data, which appears to be picking up the initial phase of the newly awarded contracts. With surcharges already lifting total charges, providers may have had less room to secure larger increases in the base rate.
Fuel volatility cuts both ways for shippers and carriers. When fuel makes up more of the total charge, the rate can move more as diesel prices change. A contract established while fuel is expensive may also have more room to come down if diesel later falls. A smaller fuel share can make costs steadier through the year, but it leaves shippers with less immediate relief when fuel prices decline.
Fuel surcharges are designed to share the effect of changing fuel costs, rather than serve as a carrier profit center. The practical tradeoff is how much of that movement gets passed through, and how quickly, under each shipper’s negotiated schedule.
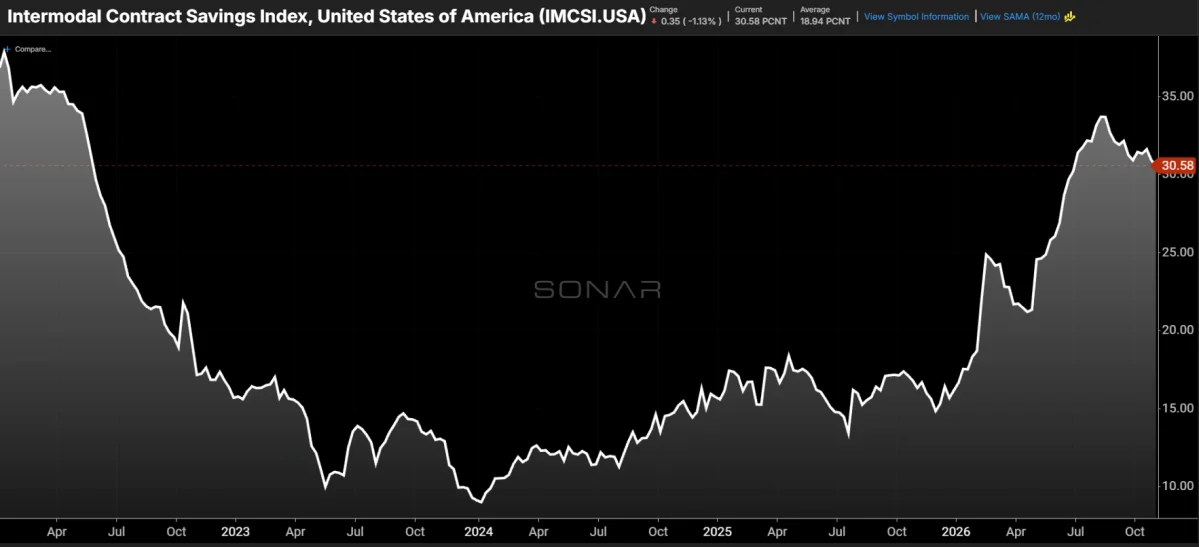
Intermodal still holds a cost gap
Despite the recent rate gains, intermodal remains substantially cheaper than truckload on comparable lanes. SONAR’s Intermodal Contract Savings Index, which measures the average difference between the two modes, shows a 30% intermodal savings. That is only slightly below the index’s June peak of 33%.
The comparison indicates that higher intermodal rates have not erased the mode’s cost advantage. There may still be room for intermodal rates to rise while remaining competitive with trucking, although the indices do not establish how individual lanes or contracts will perform. Shippers weighing a conversion need to compare the full contracted charge and service requirements on their own lanes.
More of the latest rate increases should appear in the invoice data over the coming weeks, giving shippers a clearer view of intermodal’s position against truckload. The reported lag means the current index may not yet capture the full effect of the recent fuel changes or newly reset contracts.
Service reliability remains part of that decision. A BNSF washout in New Mexico tied to recent weather and a technical outage at CSX show how rail disruptions can affect freight movement, just as disruptions can affect trucking. Those events are a reminder to consider network performance alongside the rate comparison.
Intermodal volumes have largely recovered, and growth is running at about a 7% annualized pace. For shippers, the present read is that fuel has driven most of the contract-rate surge while a significant average cost gap over truckload remains. The next few weeks of invoice data should clarify how much of the increase reflects fuel and how much is showing up in underlying contract pricing.
The rate figures are published through SONAR, which aggregates freight data into charts and maps. The SONAR data page and the chart reference accompany the published indices.
Source article: FreightWaves.